When preparing datasets prior to data analysis or machine learning, we sometimes find missing values. Missing values are generally represented with NaN which stands for Not a Number, and this can be quite an issue as many machine learning algorithms can’t handle missing data and require entire rows, where a single missing value is present, to be deleted or replaced (imputed) with a new value.
目次
What is missingno?
Missingno is a Python library that uses helpful graphics to help you understand the distribution of missing values. Heatmap and bar plot are examples of visualizations that missingno has. With this library, you can see where missing data have appeared and check the correlation between the columns containing missing values and the target column. Once the dataset has been thoroughly investigated, missing data can be better handled. Let’s put this into practice and see how it improves our data pre-processing.
Missingno Implementation
We use Google Colab in this tutorial. You can also use Jupyter Notebooks or any other similar tools for quick demonstration.
missingno installation page is available here
Installation
First, let’s install missingno with pip command.
|
1 |
pip install missingno |
Preparing Dataset and Import missingno
As our data is stored in Google Drive, let’s mount Google Colab with our Drive.
|
1 2 |
from google.colab import drive drive.mount('/content/drive') |
|
1 2 3 4 5 6 7 8 9 10 |
#importing missingno library import missingno as msno #importing pandas and other necessary libraries if needed import pandas as pd %matplotlib inline #loading dataset df = pd.read_csv('/path/to/dataset/example.csv') |
|
1 |
df.describe() |
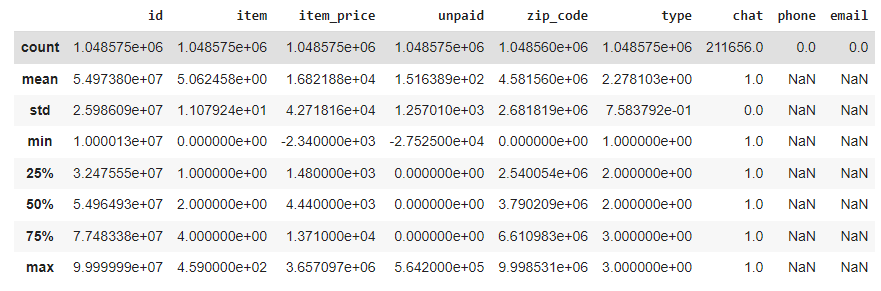
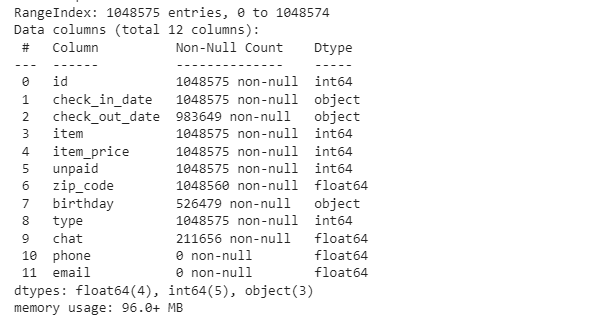
Viewing missing data with Pandas
|
1 |
df.info() |
|
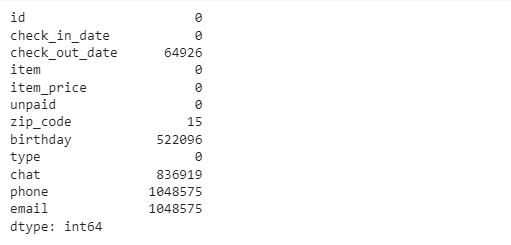
1 |
df.isna().sum() |
Using missingno
Now let’s see how missingno can give us missing data distribution visualizations.
Within the missingno library, there are 4 types of plots for visualizing data completeness: Bar Plot, Matric Plot, Heatmap, Dendrogram.
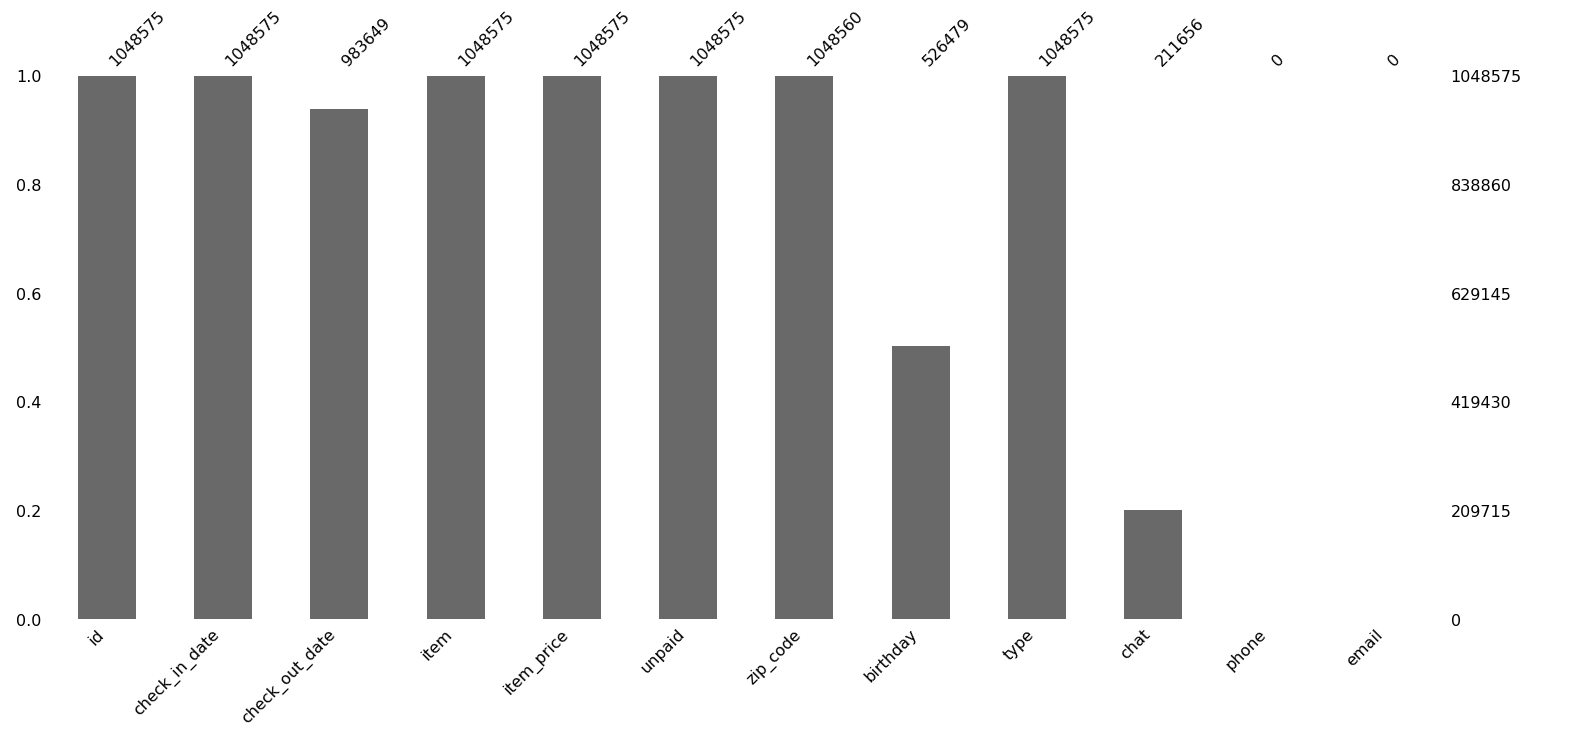
Bar Plot
1 represents the completeness of a column. The ones with shorter bars have more missing values.
|
1 |
msno.bar(df) |
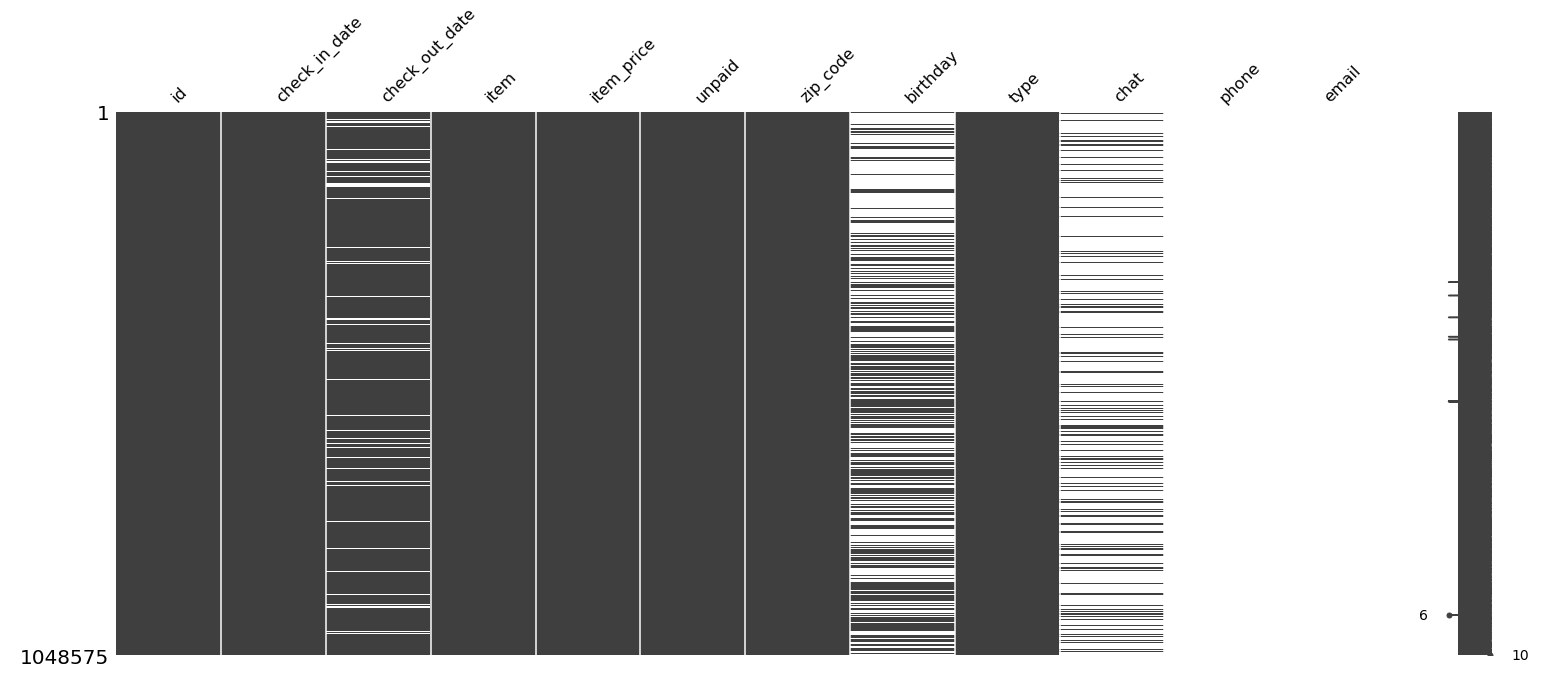
Matrix Plot
Matrix plot shows the distribution of missing data.
|
1 |
msno.matrix(df) |
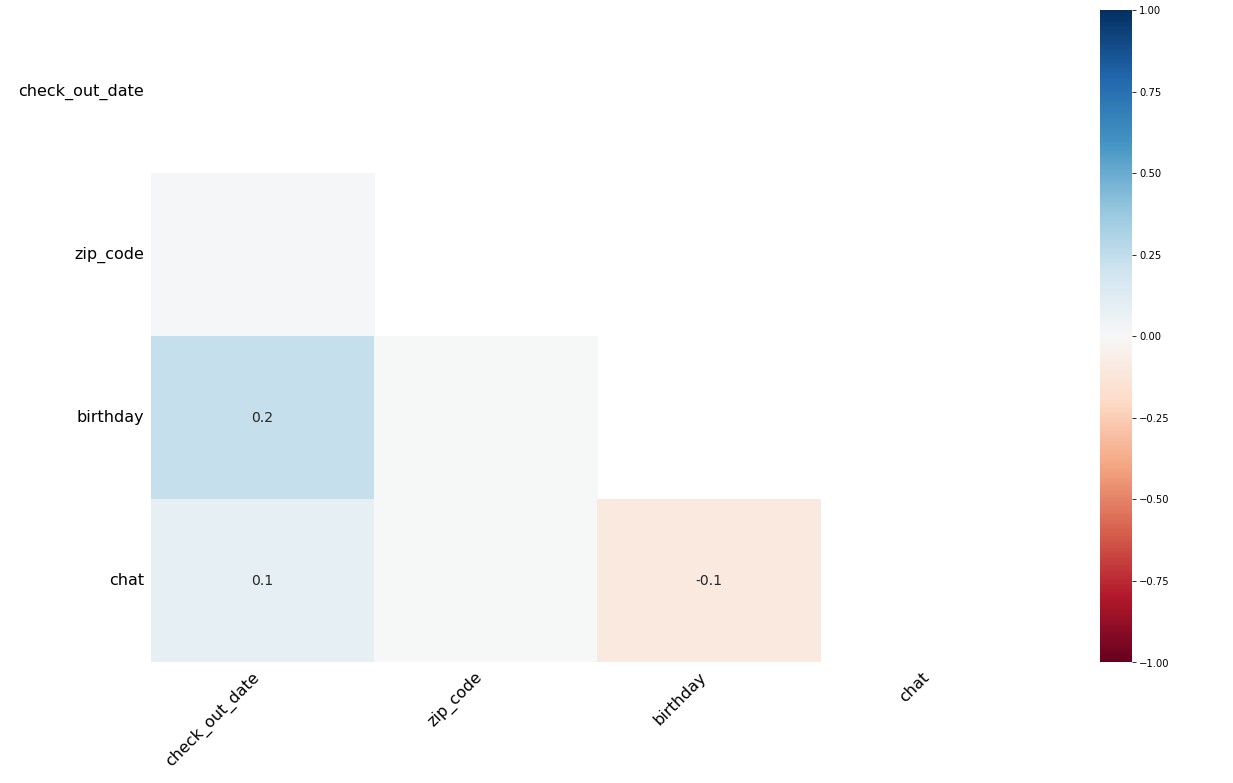
Heatmap
Heatmap is used to identify correlations of the nullity between each of the different columns.
|
1 |
msno.heatmap(df) |
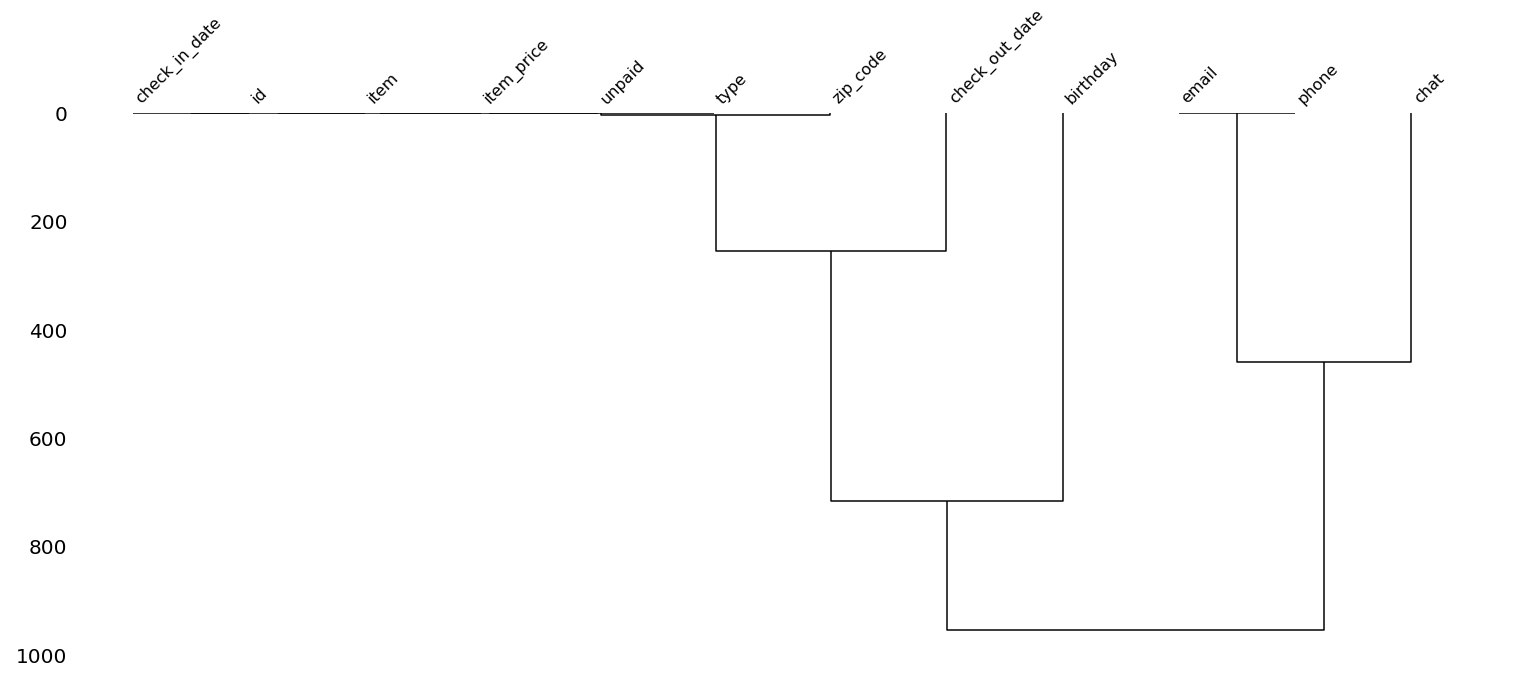
Dendogram
Dendrogram plot provides a tree-like graph generated through hierarchical clustering and groups together columns that have strong correlations in nullity.
|
1 |
msno.dendrogram(df) |
Ultimately, missingno can help us understand our dataset’s missing data better prior to data analysis and machine learning workflow by showing how much missing data is present, where it happens, and how the missing data related to other data in different columns.
- 【2024】AWS Jr.Championsを振り返る - 2025-07-01
- 中級figma教室 - 2024-12-24
- おすすめガジェット紹介!2024年12月編 - 2024-12-21
- 【Amazon RDS】意図せず突発的な再起動が起こった原因 - 2024-12-19
- Amazon ConnectでNGワードをリアルタイムに検知してSlackに通知する - 2024-12-16
【採用情報】一緒に働く仲間を募集しています